

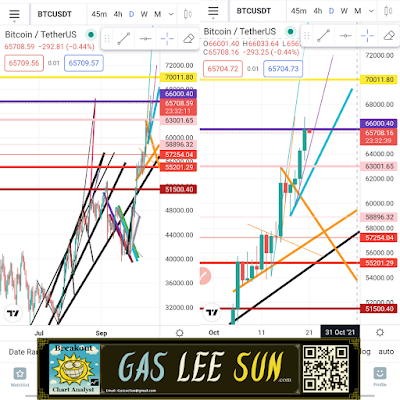
Bitcoin is still above both thin purple uptrend line & thick teal uptrend line & Btc is LOOKING SUPER SUPER SUPER BULLISH towards thick yellow line @ 70k price area... In order for BTC to stay above thin purple uptrend line bitcoin must close above thick purple line @ 66k price area today 😯 In order for bitcoin to continue thick teal uptrend line BTC needs to close above thick pink line @ 63 thousand price area today... If BTC decides to fake out below thick orange downtrend line, getting back into orange triangle, bitcoin will need to close above thin pink line @ 59k price area today in order not to break towards the downside of thick orange downtrend line heading towards thin red line @ 57,200 thick orange uptrend line today...
IF BITCOIN CLOSES ABOVE THICK PURPLE LINE TODAY BTC WILL BE BULLISH TOWARD 70k PRICE AREA, VERY VERY SOON... 🤗📈 BTC COULD MAX OUT AROUND THICK YELLOW LINE TODAY IF IT DECIDES TO BREAK ABOVE THICK PURPLE LINE.
Bitcoin must close above thick red line & thick black uptrend line @ 55.2k price today, or Btc could downtrend towards MUCH lower price levels 🥺📉 like 50k price area
51.5 thousand price area IS the max dump level bitcoin could go today.... Extra MAX worst case scenario 📉😈🌧 VERY VERY VERY VERY low chance.

No comments:
Post a Comment