

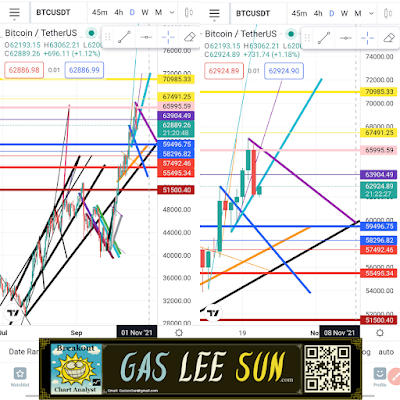
Bitcoin CLOSED below both thin purple uptrend line & thick teal uptrend line, & Created Thick Purple Downtrend line as Btc is Looking bearish towards thick blue line @ 59.5k price area today... In order for BTC to get back above thin purple uptrend line bitcoin must close above thin yellow line @ 67.5k price area today 😯 In order for bitcoin to continue thick teal uptrend line BTC needs to close above thin purple line @ 63.9 thousand price area today... If BTC decides to fake out below thick blue downtrend line, bitcoin will need to close above thin blue line @ 58.3k price area today in order not to break towards the downside of thick blue downtrend line. In order to stay above thick orange uptrend line btc must close above thin red line @ 57.5k today.

No comments:
Post a Comment