Search This Blog

Showing posts sorted by relevance for query gasleesun.com. Sort by date Show all posts

Thursday, August 31, 2023

DAY&MONTH: AUGUST 2023. GasLeeSun.com Presents: Monthly Chart Analysis About U.S. Dollar Currency Index πŸ’° [DXY] #Dollar #DXY #USD #Index #Month #Chart #Analysis #Fiat

Currently in the Month chart; the US dollar is bouncing inside of pink triangle until max breakout date JULY 2024 & looks like it's going to come down somewhere around 100.00 price area before February 2027, since it couldn't stay above of Left thick black uptrend line.

SEPTEMBER candle needs to start above 105.20 price area, In order to start bullishness again 
and 103.70 on the day chart to slow down Bearishness...πŸ“‰

The highest retest touch point the DXY can go this month is around 112.50 and that's if it wants to get back above left Thick black uptrend line...πŸ“ˆ

The lowest the US dollar can drop this month is around $95... πŸ“‰

CRYPTO WILL BE ON ITs WAY BACK UP VERY VERY SOON πŸ“‰πŸ˜πŸ“ˆπŸ“ˆπŸ“ˆπŸ“ˆπŸ“ˆπŸ“ˆπŸ€‘

THINKING LONG TERM RIGHT NOW IS THE GAME.... 
THAT'S WHY IM CURRENTLY ONLY GIVING YOU MONTHLY CHART ANALYSIS πŸ€‘❤#GasLeeSun

Sunday, December 25, 2022

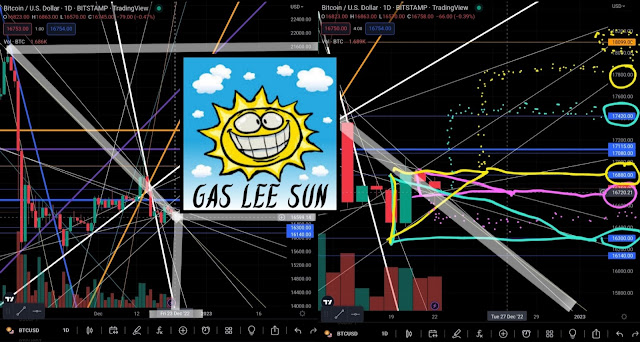
Date: 12/26/2022 GasLeeSun.com Presents: Day Chart Analysis About Cryptocurrency Bitcoin πŸ’° [BTC] #Bitcoin #Btc #Day #Chart #Analysis


12/27/2022 Bitcoin candle needs to start >16,850 price area. πŸ€‘ So it can continue current yellow, purple; Blue dotted uptrend line... & BITCOIN is still above ANOTHER super stronger negative downtrend line. πŸŽ…πŸŽ„πŸ€ΆπŸ“ˆ more bullishness is coming, so get ready.

BTC has currently positive broke outside of yellow highlighted purple triangle and now it looks like it could come shoot up towards >17,000 price area very soon. 🧐

Bitcoin candle needs to stay above 16,720; white downtrend line to keep bullish momentum heading towards higher price levels. πŸƒπŸ“ˆ

If not BTC will more than likely gravitate towards >16,500 price area. πŸ“‰

The lowest BITCOIN price touch this year is <5,000 πŸ₯Ί rare. 🚨 [Flash⚡️Crash] 🀯


_____________________________________________________________

GET Bitcoin - Click Here

Saturday, May 7, 2022

Date: 5/7/2022. GasLeeSun.com Presents: Day Chart Analysis About Cryptocurrency Shiba Inu 🐢 [SHIB]

Thursday, December 22, 2022

Date: 12/22/2022 GasLeeSun.com Presents: Day Chart Analysis About Cryptocurrency Bitcoin πŸ’° [BTC] #Bitcoin #Btc #Day #Chart #Analysis


IM GETTING MORE CRYPTO BEFORE CHRISTMAS (12/25/2022), BECAUSE THE GAINS ARE GOING TO BE HUGE !!! πŸ˜πŸ“ˆ  IM SO BULLISHπŸ‘#2023

12/23/2022 Bitcoin candle needs to start >16,720 price area. πŸ€‘ So it can stay inside yellow & pink triangles. Above the thin tan; highlighted in white super stronger negative downtrend line started on NOV 5, 2022, along with the bullish breakout of teal triangle.

BTC is currently bouncing inside pink triangle until >Dec 27,2022 and looks like it could come down to retest around 16,300 price area very soon. 🧐

Bitcoin candle needs to stay above 16,600; highlighted white downtrend line to keep bullish momentum going to higher price levels. πŸƒπŸ“ˆ

If not BTC will more than likely gravitate towards <16,000 price area. πŸ“‰

The lowest BITCOIN can price touch this year is <5,000 πŸ₯Ί rare. 🚨 [Flash⚡️Crash] 🀯


_____________________________________________________________

GET Bitcoin - Click Here

Sunday, May 1, 2022

Date: 5/1/2022. GasLeeSun.com Presents: Day Chart Analysis About Cryptocurrency Shiba Inu 🐢 [SHIB]

Tuesday, September 20, 2022

MONTH: SEP 2022. GasLeeSun.com Presents: Monthly Chart Analysis About Cryptocurrency Shiba Inu 🐢 [SHIB]


 Right now Shiba Inu is building up for at least A 3-5X very soon.
 Price currently bouncing in between white lines,
& looks like it could continue until year 2025.
 The absolute lowest price can drop is -0.00007000 till then πŸ€“ rare.

Part 2

Thursday, December 8, 2022

Date: 12/8/2022 GasLeeSun.com Presents: Day Chart Analysis About Cryptocurrency Bitcoin πŸ’° [BTC] #Bitcoin #Btc #Day #Chart #Analysis


12/9/2022 Bitcoin candle needs to be above 17,050 price area.

Bitcoin candle needs to be above 17,100 price area support before Dec 12, 2022.

If not BTC will more than likely gravitate towards >16,300 price area. πŸ“‰

Bitcoin failed to stay above pink & teal triangle's; uptrend line and that's why negativity is currently being produced towards BTC price action.

The lowest BITCOIN can price touch this year is <5,000 πŸ₯² rare.🚨[Flash Crash]⚡️


Wednesday, December 28, 2022

Date: 12/28/2022 GasLeeSun.com Presents: Day Chart Analysis About Cryptocurrency Bitcoin πŸ’° [BTC] #Bitcoin #Btc #Day #Chart #Analysis


12/29/2022 Bitcoin candle best to start >16,650 price area. πŸ€‘ 

Looks like Bitcoin is going to retest 15 thousand price area very soon, because i see alot of negative triangle patterns making btc gravitate down into blue zone πŸ₯Ά

BTC NEEDS TO STAY ABOVE THE BLUE LINES πŸ’™ 😎 πŸ˜‰ 😏 πŸ‘Œ πŸ™„ πŸ’™  so price can levitate around >23,000. ⏰️

If btc can't hold 15,800 price area level of support, then it will more than likely gravitate towards >12,000 price area. πŸ“‰

The lowest BITCOIN price touch this year is <5,000 πŸ₯Ί rare. 🚨 [Flash⚡️Crash] πŸ’°πŸ€―πŸ’Έ


_____________________________________________________________

GET Bitcoin - Click Here

Tuesday, May 31, 2022

Date: 5/31/2022. GasLeeSun.com Presents: Day Chart Analysis About Cryptocurrency Shiba Inu 🐢 [SHIB]

Friday, September 1, 2023

MONTH: September 2023. GasLeeSun.com Presents: Monthly Chart Analysis About U.S. Dollar Currency Index πŸ’° [DXY] #Dollar #DXY #USD #Index #Month #Chart #Analysis #Fiat


Currently in the Month chart; the US dollar has broke to the upside of pink triangle & looks like it's going touch somewhere around 108.50 price area very soon, plus price action is still above pink highlighted uptrend line started back April 2011.

OCTOBER candle needs to start above 105.80 price area, In order to continue thick blue uptrend line bullishness πŸ“ˆ

The highest retest touch point the DXY can go this month is around 113.50 and that's if it wants to get back above left Thick black uptrend line, making it Super bullishπŸ“ˆ

The lowest the US dollar can drop this month is around $95.50... πŸ“‰

Since the US Dollar September candle couldn't start above both thick yellow and orange downtrend lines, I feel the DXY could produce a fake out to the downside the End of this month... 
BE CAREFUL CRYPTO HODLERS πŸ˜‰ 

πŸ“… DXY 2023 YEARLY CHART ANALYSIS: 

Thursday, May 12, 2022

Date: 5/12/2022. GasLeeSun.com Presents: Day Chart Analysis About Cryptocurrency Shiba Inu 🐢 [SHIB]

Friday, October 7, 2022

(Part 2) MONTH: OCT 2022. GasLeeSun.com Presents: Monthly Chart Analysis About Cryptocurrency Bitcoin πŸ’° [BTC]


 Currently BTC is bouncing inside of white triangle, 
since it failed to stay inside peach color triangle; producing negativity towards <15,000 price.
Bitcoin needs to start above 18,150 price area Month; NOV 2022
If not the pain will continue. πŸ“‰

https://www.gasleesun.com/2022/10/month-oct-2022-gasleesuncom-presents.html